Technical Background
Technical documentation is available for users of the Water Security Compass, explaining the definitions of the published indicators and the methodologies used for their evaluation.
Water Security Compass Technical Note (Version 1.0)
[Published: June 8, 2026]
This documentation provides comprehensive explanations of the
definitions and assessment methods for the various data and
indicators featured in the global version of the Water
Security Compass. It also covers the climate and
socio-economic change scenario data used for future risk
assessments.
Both Japanese and English versions can be
downloaded from the link below.
Assessment of regional water scarcity using data with higher spatial resolution (Japan viewer)
In the Japan domain version, as with the global version, the evaluation is based on the H08 model’s calculation results. The main difference between the Japan version and the global version lies in the spatial resolution of the input data to the H08 model and the method used to create it. The Japan version uses a 1-minute spatial resolution (about 2 km), which is more detailed than the global version that is 5-minute (about 9 km). The input data includes data on meteorological conditions, agricultural land cover, water demand, dams, canals, and other relevant factors available in Japan.
Related articles: Hanasaki et al. (2022), Oda et al. (2024) (in Japanese) , Kawasaki et al., (2024) (in Japanese)
Application
An explanation of the application of the indicators provided by Water Security Compass is given below.
Evaluating the Dependency Risk on Water Resources:
CDTD and DTD
Water shortages caused by narrow margins of water supply and demand can have numerous effects in the operations of a company. Examples are production disruptions, making supply chains that depend on agricultural products more vulnerable, cost increases, and creating restrictions for business expansion.
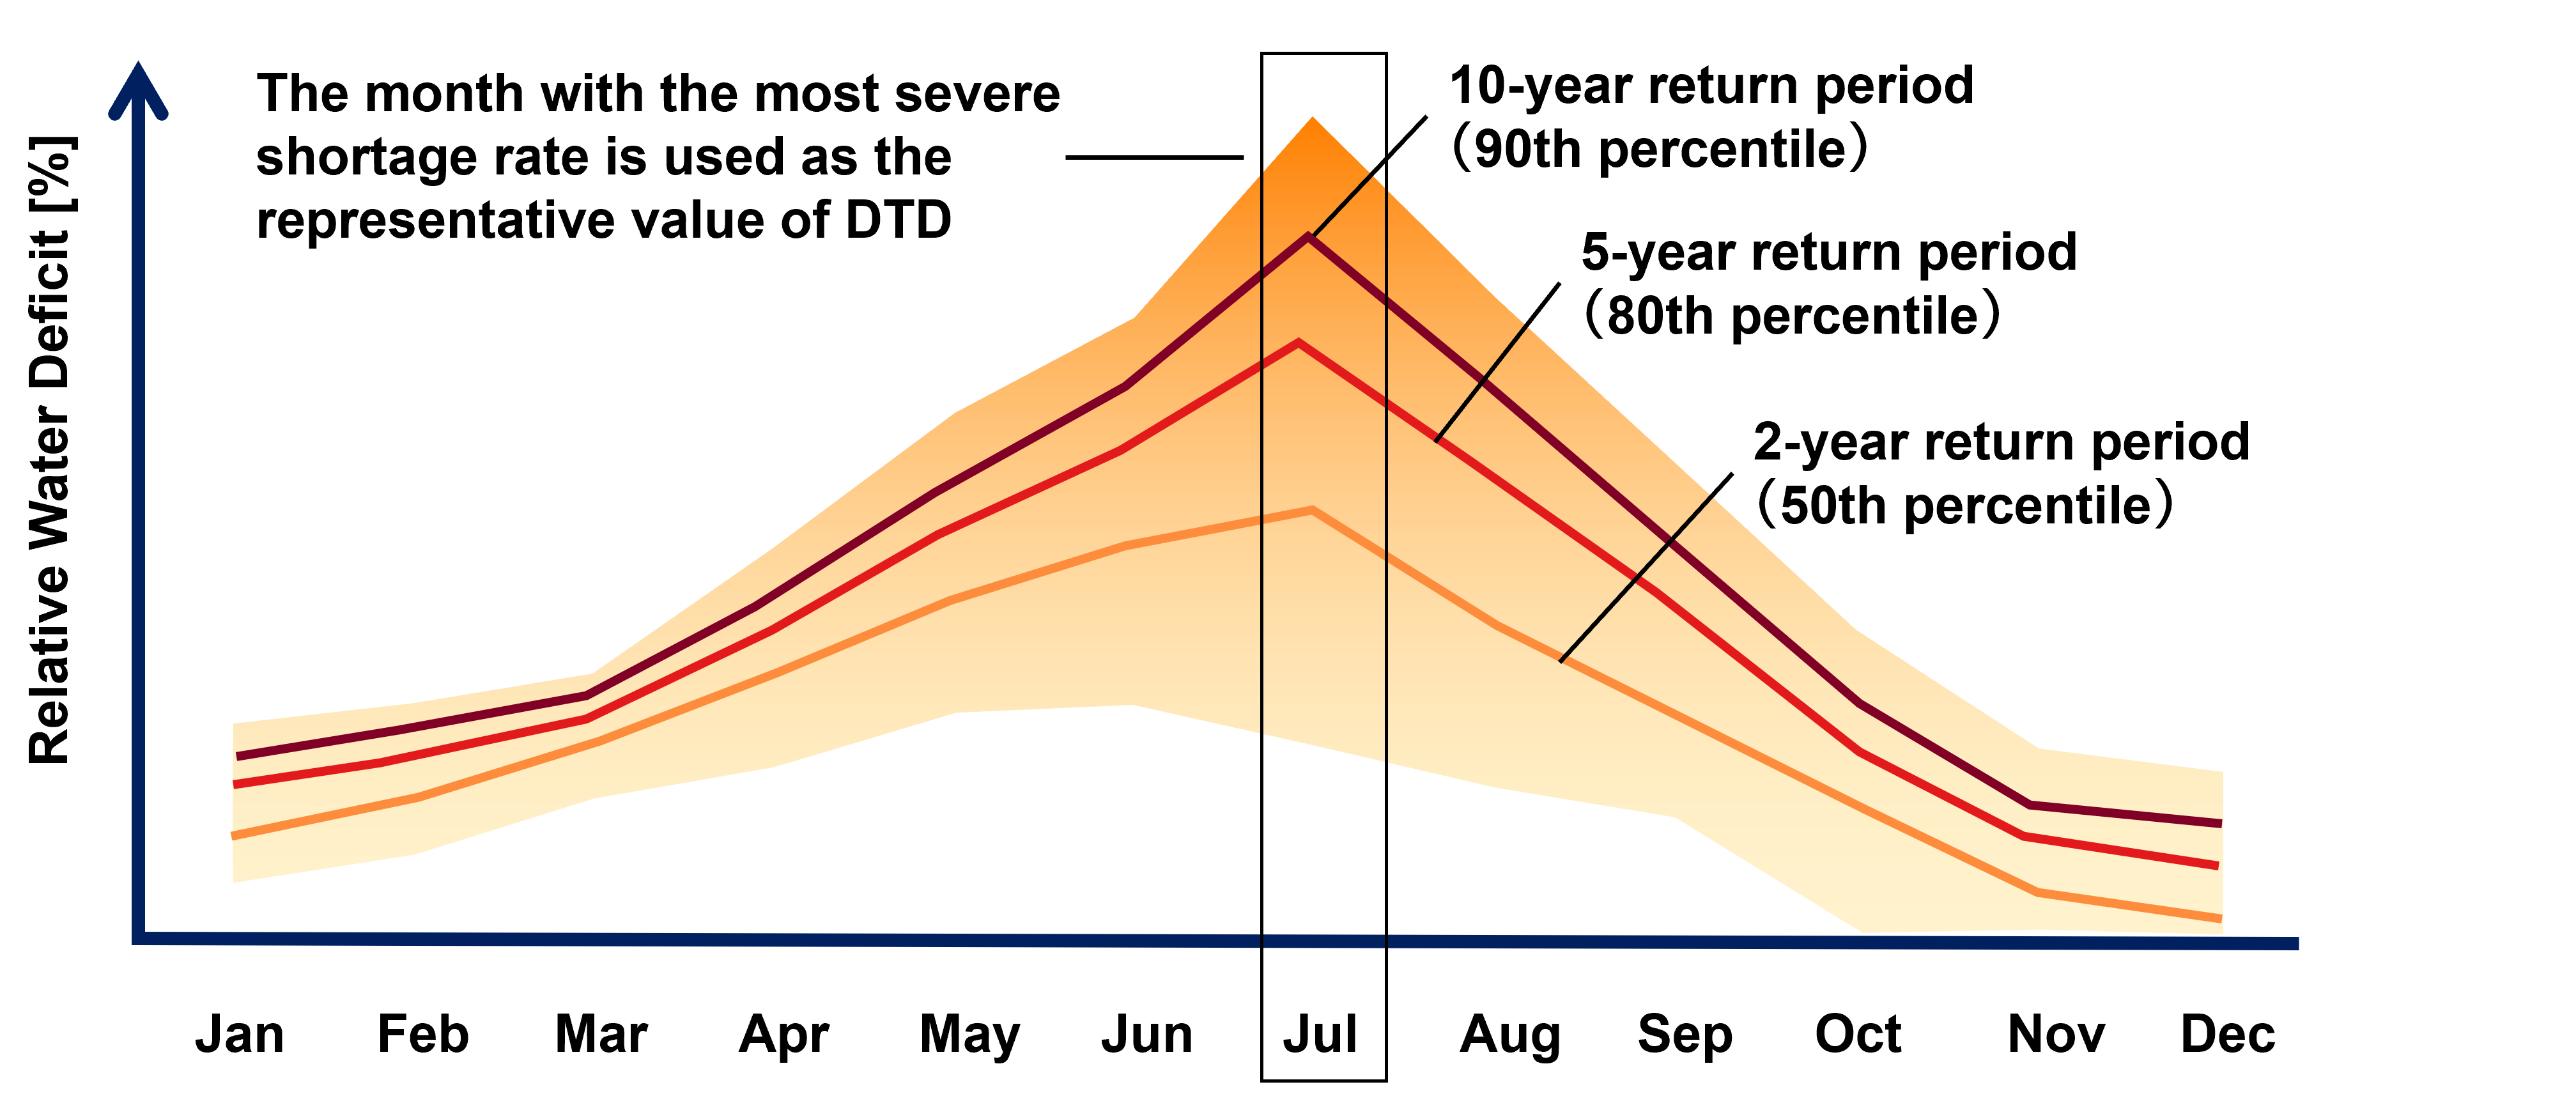
Cumulative Deficit to Demand (CDTD) and Deficit to Demand (DTD) take into account seasonal and interannual variations in water resources and water demand to assess the gap between water supply and demand. Of these, CDTD indicates the mean condition of water scarcity, while DTD indicates the monthly water scarcity with different probabilities of occurrence. Naturally, droughts with a frequency of one in two years signify a higher risk than droughts that happen once every five years (Figure 2). The CDTD can be used for relative comparisons of mean condition of water scarcity, and the DTD can be used for an assessment of the impact of a drought on business activities considering the frequency and magnitude of droughts.
Evaluating the Impact on Water Resources
Available WAter REmaining (AWARE)
The adoption of a Global Biodiversity Framework (GBF) at the UN Convention on Biological Diversity (COP15), held in Montréal at the end of 2022, was a global agreement to halt and reverse worldwide biodiversity loss by 2030. The sustainable use and management of biodiversity and the maintenance of nature’s contributions to people, including ecosystems functions and services, are embedded in one of the goals of the GBF. Moreover, several of the targets that are part of this commitment are a call to the corporate sector to further map, analyze, and report on their nature-related impacts and dependencies. Undoubtedly, it has become indispensable for business to quantify the impacts and pressure that their activities put on freshwater resources and ecosystems in order to contribute to the achievement of the goals and targets of the GBF.
For a given water consumption volume, the level of pressure will be more critical in watersheds that have lower rates of freshwater replenishment or drier precipitation regimes. Therefore, it is recommended to evaluate the level of pressure a business is putting on a watershed by comparing water volumes of availability and consumption.
The International Standard ISO 14046 on principles, requirements and guidelines related to water footprint assessment defines water footprint as an indicator of the potential environmental impacts related to water. To assess the potential environmental impacts related to water use, we need to focus on the water consumption volume contributing to water scarcity, which is measured by an indicator denominated water-scarcity footprint. This indicator can be calculated by multiplying the water footprint inventory, which is the total water consumption, and a characterization factor (CF) that represents the local value of water. Water Security Compass includes computed and mapped values of AWARE, which is a CF that was developed to be employed in the computation of water-scarcity footprint. In this way, a business can estimate their water-scarcity footprint by simply multiplying the consumption volume of one of their facilities and the respective value of AWARE. Naturally, for the same consumption volume, the impact on the watershed can be more critical for larger values of AWARE.

Notes
Although Water Security Compass presents assessment results for specific regions and times of the year, it should be noted that the mapped values are based on global datasets and therefore they have a limited accuracy. We recommend using the data provided here to have a wide picture of the local state of water-related risks and complementing the assessment with finer or more detailed observations.